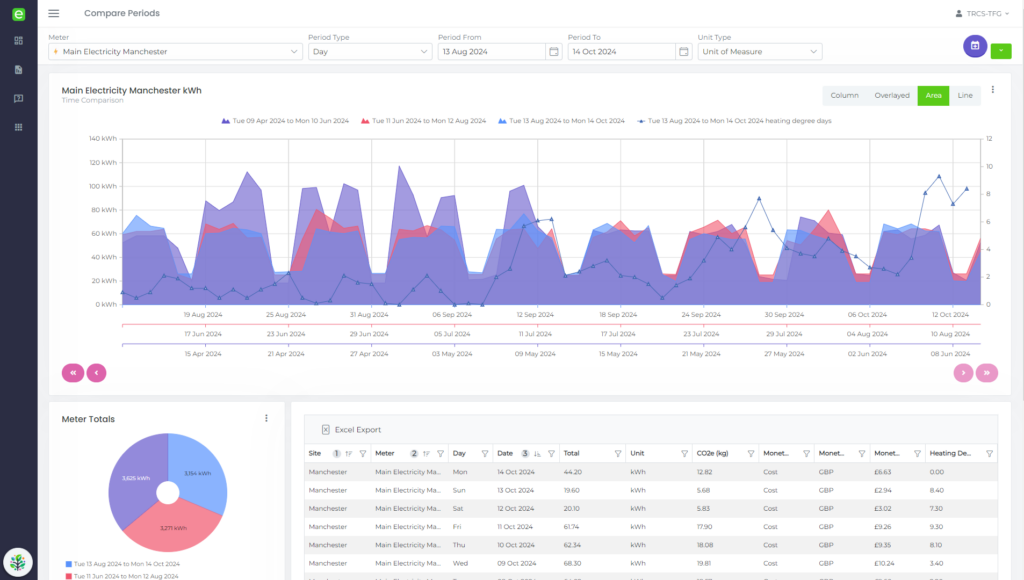
ecoDriver captures data from main fiscal meters or/or sub-meters to visualise building energy performance, whether utility consumption (electricity, gas, water, etc.) or energy generation (solar, wind, etc).
ecoDriver® provides a suite of features to systematically identify ‘low hanging fruit’ opportunities to improve a building’s performance, manage the removal of inefficiencies, and maintain realised savings.
- Simple and easy-to-understand dashboards, charts and reports
- Daily, weekly, monthly & yearly energy profiles with targets
- League charts to compare and benchmark buildings, zones and services
- Normalise data by occupancy or gross internal area (GIA)